
BENGALURU – For decades, Bengaluru was defined by its temperate climate, lush canopies, and the gentle "pensioner’s paradise" moniker. However, the city’s meteoric rise as the "Silicon Valley of India" has brought with it a shadow that no longer dissipates with the morning mist. A landmark four-year atmospheric study has now quantified the environmental toll of this rapid urbanization, revealing a city struggling to breathe under the weight of its own success.
The research, led by Dhanya G. and a collaborative team from the National Institute of Advanced Studies (NIAS), Bangalore University, and the Indian Institute of Tropical Meteorology (IITM), provides a sobering look at the deterioration of air quality in India’s premier tech hub. Published in the journal Theoretical and Applied Climatology, the study tracks the invisible killers—carbon monoxide (CO) and black carbon (BC)—uncovering a direct correlation between the city’s economic boom and a brewing public health emergency.
Main Facts: The Invisible Ceiling and the Bimodal Pulse
The core of the study lies in its revelation of how Bengaluru’s unique geography and meteorology interact with human activity. Unlike coastal cities that benefit from sea breezes, Bengaluru sits on a Deccan plateau, roughly 900 meters above sea level. This altitude, combined with specific atmospheric dynamics, creates what researchers describe as a "shifting atmospheric ceiling."
Technically known as the Planetary Boundary Layer (PBL), this is the lowest part of the atmosphere that responds directly to the Earth’s surface. The study found that this layer acts as a dynamic "room" for pollutants. During the day, solar radiation warms the ground, causing the PBL to expand and rise. This allows vehicular emissions to mix with larger volumes of air and disperse. However, as the sun sets, the "ceiling" crashes down, trapping pollutants in a shallow layer close to the ground—precisely when the city’s evening rush hour begins.
Furthermore, the researchers identified a "bimodal" or double-peak pattern in daily pollution levels. The first peak occurs between 7:00 AM and 11:00 AM, and the second between 7:00 PM and 9:00 PM. These windows align perfectly with the city’s notorious traffic congestion, confirming that personalized transit—rather than industrial activity—is the primary driver of the city’s toxic air.
Chronology: From Garden City to Tech Megacity
To understand the current crisis, the study contextualizes the data within Bengaluru’s explosive growth timeline. The transformation of the city over the last three decades has been nothing short of staggering:
- The 1990s – Early 2000s: The liberalization of the Indian economy and the IT boom saw Bengaluru transition from a quiet administrative center to a global tech destination.
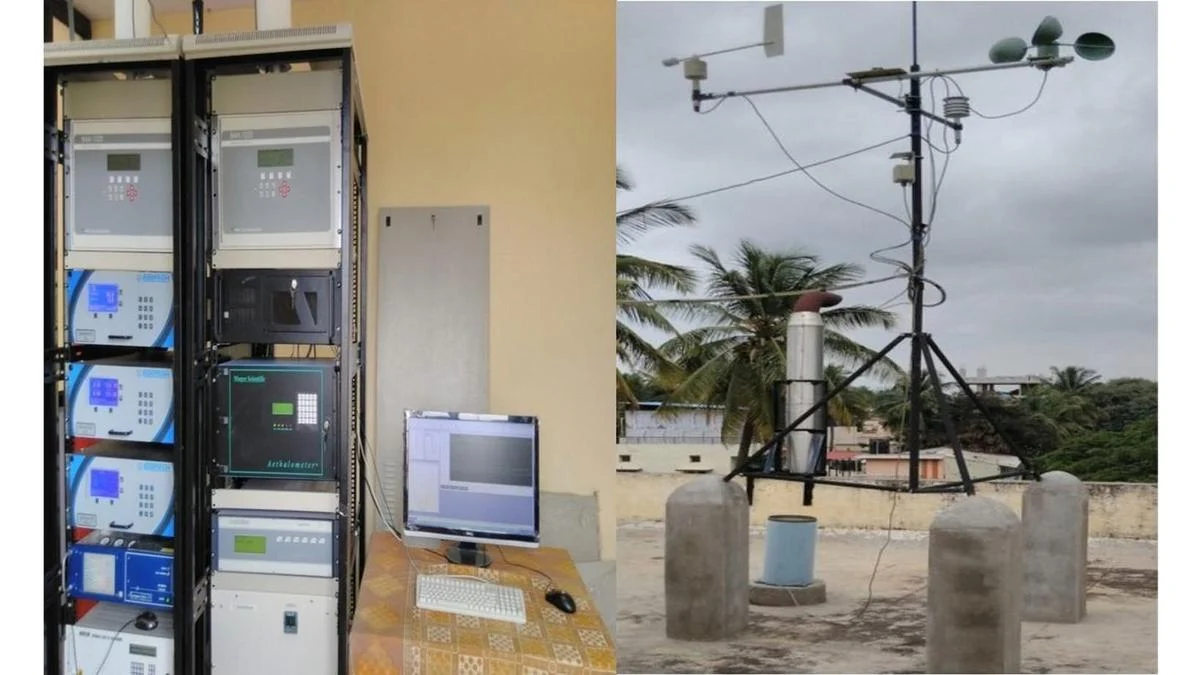
- 2015 – 2018 (The Study Period): This four-year window served as the primary data collection phase. During this time, the researchers utilized high-precision optical and infrared sensors installed at a monitoring station on the rooftop of the BMS College of Engineering in South Bengaluru.
- The Vehicle Explosion: By 2016, the city reached a critical mass of 600 vehicles for every 1,000 people. This registration rate was more than double that of New Delhi, a city long considered the face of Indian air pollution.
- 2017 – 2018 (The Monsoon Variance): These years saw unusually high rainfall, providing the researchers with a natural experiment to observe "rain scavenging"—the process by which precipitation physically washes soot (black carbon) out of the atmosphere.
- Present Day: With a population exceeding 13.5 million, Bengaluru is now the third most populated megacity in India. The study highlights that the 10.6% annual growth in vehicle registrations has outpaced infrastructure and environmental safeguards.
Supporting Data: Quantifying the Crisis
The numbers generated by the NIAS and IITM team provide a stark contrast to the city’s former reputation as a "clean" city. Over the 48-month period, the sophisticated sensors sniffed out the chemical signatures of incomplete fuel combustion.
Carbon Monoxide (CO) Trends
Carbon monoxide is a colorless, odorless gas that interferes with the blood’s ability to carry oxygen.
- Average Concentration: 0.84 parts per million by volume (ppmv).
- Peak Concentration: Spikes as high as 4.07 ppmv were recorded during heavy traffic intervals.
- Net Rise: Perhaps the most alarming finding was a 52% net increase in CO concentrations over the four-year study period, directly reflecting the compounding emissions from an ever-expanding fleet of private vehicles.
Black Carbon (BC) Trends
Black carbon, or "soot," is a microscopic particle that absorbs solar energy and contributes significantly to both localized warming and respiratory issues.
- Average Concentration: 3.28 micrograms per cubic meter (µg/m³).
- Peak Concentration: Maxima of 9.5 µg/m³ were recorded.
- The Monsoon Effect: While CO continued to rise due to traffic volume, BC levels showed a slight dip during the heavy rains of 2017 and 2018. This proved that while rain can wash away physical particles (BC), it does little to mitigate gaseous pollutants (CO).
Temperature Spikes
The study also noted an "artificial localized temperature spike" of up to 2.5 degrees Celsius. This "Urban Heat Island" effect is caused by the replacement of green cover and wetlands with heat-absorbing concrete and asphalt, further complicating the city’s atmospheric stability.
Official Responses and Expert Perspectives
While the study was academic in nature, its findings have resonated with urban planners and environmentalists across Karnataka. While official government responses often emphasize the progress of the National Clean Air Programme (NCAP), experts argue that Bengaluru’s specific topography requires more than general national guidelines.
Environmental activists point out that the Karnataka State Pollution Control Board (KSPCB) has historically focused on industrial zones in the north and east. However, this study—conducted in the heart of South Bengaluru—proves that residential and commercial transit corridors are equally, if not more, dangerous.
"This data validates what commuters feel every day," says an urban planning consultant not involved in the study. "We have focused on ‘moving vehicles’ rather than ‘moving people.’ The result is a city where the atmosphere has no room to breathe because we have filled it with 600 vehicles per 1,000 people."
The researchers themselves have urged policymakers to look beyond raw numbers. By using the World Health Organization’s (WHO) AirQ+ software, the team was able to translate chemical data into health outcomes. The model mathematically demonstrated a direct link between long-term exposure to these pollutants and increased mortality from ischemic heart disease among Bengaluru’s residents.
Implications: A Roadmap for a Liveable Future
The implications of this four-year investigation are profound, shifting the conversation from abstract environmentalism to an urgent public health priority. The study identifies three critical areas for intervention:
1. The Necessity of the "Evening Intervention"
Since the atmosphere "collapses" in the evening, trapping pollutants in a shallow layer, the researchers suggest that traffic management must be most aggressive during the post-sunset rush hour. This could include stricter low-emission zones that only activate in the evening or phased office exit timings to prevent the massive, concentrated "bimodal" peak.
2. Transitioning the Transit Model
The 10.6% annual growth in private vehicles is unsustainable. The study’s findings provide the empirical data needed to justify massive investments in electric public transit. By reducing the number of internal combustion engines on the road, the city can lower the baseline of CO and BC that the atmosphere is forced to process.
3. Reversing the Heat Island Effect
The 2.5-degree temperature spike identified in the study isn’t just about comfort; it affects how pollutants disperse. Expanding green corridors and protecting remaining water bodies (keres) is essential to restore the natural thermal regulation that once defined the city. More vegetation means a more stable planetary boundary layer, potentially preventing the "ceiling" from dropping so low in the evenings.
Study Limitations and Future Research
The researchers acknowledge that their data, while comprehensive, came from a single high-altitude monitoring station. This means that ground-level exposure for a commuter stuck in a "traffic canyon" at Silk Board or Hebbal might be even higher than the recorded peaks. Future studies will need to incorporate "chemical tracer technology" to distinguish between diesel exhaust, petrol emissions, and biomass burning from the city’s informal sectors.
Conclusion
Bengaluru stands at a crossroads. The NIAS-IITM study serves as a scientific "canary in the coal mine," warning that the city’s economic engine is currently fueled by the health of its citizens. The transition from "Garden City" to "Silicon Valley" does not have to be a one-way street toward environmental degradation. With the data provided by this four-year atmospheric audit, urban administrators now have the evidence required to implement smarter, science-based interventions. The goal is clear: to ensure that the only thing "exponential" about Bengaluru is its innovation, not its air pollution.
