

New Delhi, India – October 26, 2026 – As the Common Admission Test (CAT) 2026 draws nearer, a ripple of discussion has emerged across aspirant circles regarding a noticeable dip in registration numbers. While the headline figure of 2.84 lakh registrations, a decrease of approximately 11,000 from last year, has fueled speculation of easier cutoffs and a less competitive landscape, a deeper dive into historical data and the mechanics of the CAT exam reveals a more nuanced reality. Experts and data analysts caution against premature relief, emphasizing that the perceived advantage of a smaller applicant pool is often overstated and that the actual determinant of percentile remains firmly rooted in the exam’s inherent difficulty and individual performance.
The narrative circulating on social media platforms and online forums suggests a direct correlation between reduced registrations and a subsequent drop in the marks required to achieve a specific percentile. This sentiment, while understandable in the high-stakes environment of MBA admissions, is largely a misinterpretation of the data. The CAT percentile is a measure of an individual’s performance relative to all other test-takers, and while the absolute number of candidates might decrease, the proportional standing of each aspirant is what truly matters. Furthermore, the historical trend indicates that the difficulty of the CAT paper itself has a far more significant and unpredictable impact on score-to-percentile conversions than fluctuations in registration numbers.
The Headline Figure: A Closer Examination of Registration Trends
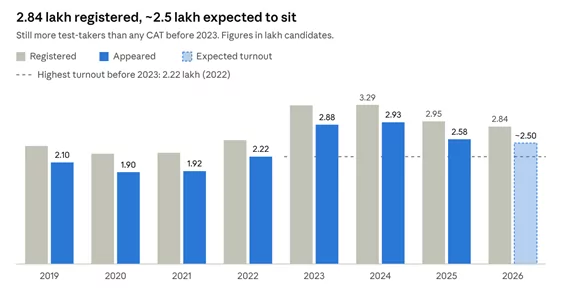
CAT 2026 has recorded approximately 2.84 lakh registrations, marking a decline of about 3.7% from the 2.95 lakh registrations seen in the previous year. This follows a trend of decreasing numbers since the peak of 3.29 lakh registrations in 2024. While the current figures represent the second consecutive year of decline, it is crucial to contextualize these numbers within a broader historical perspective.
Even with the current reduction, the CAT 2026 applicant pool remains larger than any year prior to 2023. The surge in registrations observed in 2023-24 was an anomaly, likely driven by a confluence of factors including pent-up demand post-pandemic and a perception of a more accessible admission cycle. Therefore, the current figures, while a dip from the recent peak, do not necessarily signal a return to a significantly less competitive era. The “outlier” year of 2023-24 should not be mistaken for the new normal.
Beyond Registration: The True Competition Lies in Attendance
A critical distinction often overlooked in the current discourse is the difference between the number of candidates who register for the CAT and the number who actually appear for the examination. Historically, there has been a significant gap between these two figures, with attendance rates ranging between 83% and 89% of registered candidates. In CAT 2025, for instance, out of 2.95 lakh registrations, approximately 2.58 lakh candidates appeared for the exam. For CAT 2026, the projected turnout is estimated to be around 2.5 lakh.
This difference in attendance accounts for several categories of individuals who, despite paying the registration fee, do not pose a direct competitive threat to serious aspirants. These often include:
- Casual Aspirants: Individuals who register "just to see" or without a serious commitment to preparation.
- Students with Alternative Offers: Final-year students who secure campus placements or other admission offers before the CAT exam date.
- Professionals with Shifting Priorities: Working professionals whose career trajectories or appraisal cycles may take precedence over their CAT preparation.
These individuals, while contributing to the registration numbers, are generally not the ones aiming for the top percentiles. Therefore, the actual number of serious contenders in the examination hall is considerably smaller than the headline registration figure suggests. The reduction in the number of actual test-takers, while less dramatic than the registration dip, is thus even less impactful in terms of competition for the highest echelons of percentile rankings.
Percentile: A Measure of Relative Standing, Not Absolute Headcount
The core misunderstanding surrounding the impact of registration numbers on percentile lies in the definition of percentile itself. A 99th percentile signifies that a candidate has performed better than 99% of all test-takers. This is a measure of relative performance.
If the total number of candidates in the examination hall decreases, the absolute number of candidates within each percentile bracket also shrinks proportionally. For example, if last year with approximately 2.58 lakh test-takers, the 99th percentile represented the top roughly 2,580 candidates, this year with an estimated 2.5 lakh test-takers, the 99th percentile would represent the top roughly 2,500 candidates.

The argument that a smaller pool automatically grants an easier percentile is therefore flawed. A smaller room does not change the proportion of individuals required to achieve a certain rank. While each percentile band might become "less crowded" in absolute terms, the marks required to reach that band are not inherently lowered. The real determinant of the marks needed for a particular percentile lies elsewhere.
The Unpredictable Architect of Percentiles: The Exam Paper
The most significant factor influencing the marks required for any given percentile is the difficulty and pattern of the CAT exam itself. Historical data spanning several years reveals a much stronger correlation between the exam’s structure and the score-to-percentile conversion than between registration numbers and percentile outcomes.
Analysis of five years of CAT score-vs-percentile data demonstrates substantial fluctuations in the marks needed to achieve the 99th percentile, ranging from 76 to 98 marks. These variations cannot be explained by changes in the number of candidates.
Consider the stark contrast between CAT 2023 and CAT 2024. Despite a negligible change in the number of test-takers, the 99th percentile score jumped by an impressive 19 marks in CAT 2024. This was primarily attributed to a more accessible and student-friendly paper. Conversely, between CAT 2021 and CAT 2022, an increase of approximately 30,000 test-takers did not lead to a rise in the 99th percentile score; in fact, it fell by 14 marks, indicating the paper’s difficulty played a more decisive role.
This data underscores a fundamental truth: a challenging Verbal Ability and Reading Comprehension (VARC) section, a complex Data Interpretation and Logical Reasoning (DILR) set, or a quantitatively rigorous Quantitative Aptitude (QA) section can dramatically alter the scoring curve, irrespective of the number of individuals attempting the exam. An 11,000-registrant decrease is unlikely to shift the percentile benchmarks as significantly as one particularly difficult DILR problem or a set of unexpectedly complex QA questions.
A Modest Tailwind: The Lower Rung of the Percentile Ladder
While the impact of a smaller applicant pool on top percentiles is minimal, there is a valid, albeit limited, argument to be made for its influence on lower percentile brackets, particularly concerning IIM shortlisting.
IIMs typically aim to select a specific number of candidates for their interview rounds. If the total number of candidates appearing for the exam decreases while the number of interview slots remains relatively constant, IIMs may need to dip slightly deeper into the percentile list to fill their quotas.
Illustrative calculations demonstrate this effect:
| If an institute calls… | ~2.93 lakh appear (2024) | ~2.58 lakh appear (2025) | ~2.5 lakh appear (2026, expected) |
|---|---|---|---|
| 3,000 candidates (top-IIM) | 98.98 %ile | 98.84 %ile | 98.80 %ile |
| 15,000 candidates (mid-tier) | 94.88 %ile | 94.19 %ile | 94.00 %ile |
As evident from the table, at the higher end (e.g., 3,000 candidates), the shift in percentile is marginal, around 0.2 percentile points, which is often within the margin of error for a single question. However, in the mid-tier percentile bands (e.g., 94-95%), the difference becomes more noticeable, moving closer to 0.9 percentile points. This can represent a modest advantage for candidates targeting these admission slots.
It is crucial to acknowledge two significant caveats to this observation. Firstly, IIMs officially publish minimum percentile cutoffs as a policy. These cutoffs are generally rigid and do not automatically adjust downwards solely due to a dip in registration numbers. Secondly, the final IIM shortlist is a composite score that takes into account various parameters beyond the CAT percentile, including academic records (Class 10, 12, graduation), work experience, and diversity factors. Therefore, a slight shift in percentile due to a smaller pool might not be the deciding factor in the overall shortlisting process. Aspirants are strongly advised to consult the specific shortlisting criteria of their target institutions.
Identifying the Candidates Who Are Not Registering
While official data on the profile of non-registered candidates is unavailable, informed reasoning suggests that the individuals opting out are likely not the core competitive group vying for the 95+ percentile ranks. Several factors may be contributing to this trend:
- Robust Job Market for Graduates: A strong economy often presents attractive job opportunities for fresh graduates, reducing the immediate perceived necessity of pursuing an MBA.
- Escalating IIM Fees: The substantial increase in tuition fees for flagship IIM programs, now approaching ₹21 lakh, can be a deterrent for some aspirants, especially those with financial constraints or seeking a clearer return on investment.
- Congested Entrance Exam Calendar: The proliferation of other prominent MBA entrance exams like NMAT, SNAP, and XAT creates a crowded examination calendar, potentially leading some aspirants to prioritize other options or spread their focus too thinly.
- Post-Admission Uncertainty: The admission process in the previous year, marked by instances of revoked offers and revised merit lists, may have created a sense of apprehension and uncertainty among potential candidates.
These pressures disproportionately affect the "undecided" or less committed aspirants. Candidates who have invested significant time and effort in mock tests, accuracy tracking, and strategic preparation are less likely to be deterred by fee hikes or a competitive environment. It is plausible that the CAT 2026 applicant pool might, in fact, be more serious and focused, comprising individuals with a stronger commitment to pursuing an MBA. This is not a cause for panic, but rather a reminder to maintain a rigorous and disciplined preparation strategy.
Maximizing the Remaining 38 Days: Focus on Controllables
Given that the registration numbers have a limited impact on percentile scores, aspirants should redirect their energy towards aspects they can control and that demonstrably influence their performance. The data points towards several key areas for focused effort in the remaining 38 days:
- Mock Test Analysis: Go beyond simply taking mocks. Deeply analyze your performance, identify recurring errors, and understand the root cause of mistakes. Focus on improving accuracy and time management for each section.
- Sectional Strategy Refinement: Based on your mock analysis, fine-tune your strategy for VARC, DILR, and QA. Experiment with different approaches to question-solving and section order.
- Weak Area Focus: Dedicate targeted practice to your weakest areas. This might involve revisiting fundamental concepts, working through specific types of problems, or practicing under timed conditions.
- Conceptual Clarity: Ensure a robust understanding of fundamental concepts, especially in QA and DILR. Superficial knowledge can lead to errors under pressure.
- Exam Day Preparedness: Simulate exam day conditions during your mocks, including managing time, taking breaks, and staying calm. Mental preparation is as crucial as academic preparation.
A More Constructive Message to Share
Instead of perpetuating the myth of falling cutoffs, the focus should shift to strategic preparation and realistic expectations. The next time the "cutoffs will fall" message circulates, consider sharing these points:
- Percentile is Relative: Your percentile is determined by your performance against others in the exam hall, not the absolute number of test-takers.
- Paper Difficulty is Key: The actual CAT paper’s difficulty level is the primary driver of score-to-percentile conversions, far more than registration numbers.
- Attendance Matters More: The number of candidates who actually appear for the exam is a more relevant metric than registrations.
- Top Percentiles Unaffected: The marks needed for top percentiles are unlikely to see significant changes due to this registration dip.
- Focus on Your Preparation: The remaining days are best spent on rigorous practice, analysis, and refining your strategy.
The CAT 2026 exam, scheduled for November 29th, will present its own unique challenges and opportunities. While the registration numbers may have dipped, the underlying competitive spirit and the aspiration for top MBA programs remain undiminished. By focusing on controllable factors and adopting a data-driven approach, aspirants can navigate the remaining preparation period with clarity and confidence, aiming to secure their place among the best. The true determinant of success lies not in the size of the crowd, but in the strength of one’s preparation and performance on the day of the exam.
Connect with fellow aspirants and gain valuable insights on the PaGaLGuY CAT 2026 Exam Preparation discussion forum.