

New Delhi: Amidst widespread discussions and a flurry of messages circulating on social media, a significant drop in registrations for the Common Admission Test (CAT) 2026 has ignited a debate about its potential impact on percentile cutoffs. While many are quick to assume a lower number of applicants translates to an easier path to coveted IIM seats, a closer examination of historical data and the mechanics of the CAT examination reveals a more nuanced reality. The prevailing sentiment that a reduced applicant pool will automatically lower cutoffs is, for the most part, a misconception, and aspirants would be better served by focusing on controllable factors rather than the shifting sands of registration numbers.
The Numbers Game: Decoding the Registration Dip
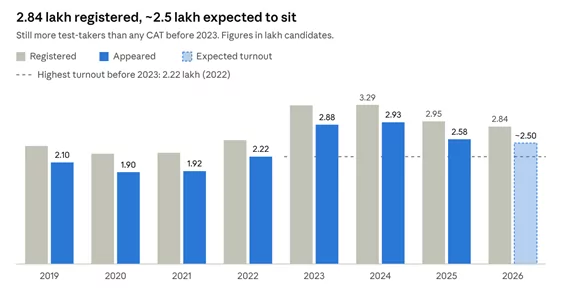
This year’s CAT 2026 has seen approximately 2.84 lakh registrations, marking a decrease of around 11,000 applicants, or 3.7%, compared to the 2.95 lakh who registered last year. This follows a similar downward trend from the peak of 3.29 lakh registrations recorded in 2024. This decline, though statistically evident, is being amplified in online forums and messaging groups, creating a sense of premature relief among some candidates.
However, a broader perspective on the registration figures suggests that the 2024 surge was an anomaly rather than the new norm. Even with the current dip, the 2026 registration numbers remain higher than those seen in the years prior to 2023, a period when securing high percentiles and gaining admission to IIMs was still a significant challenge. This historical context is crucial for understanding that the current applicant pool, while smaller than the recent peak, is still substantial.
Beyond Registration: The True Competition on Exam Day
The number of candidates who register for CAT is merely a preliminary figure. The actual competition is determined by the number of individuals who appear for the examination on the scheduled day. Historically, between 11% and 17% fewer candidates have shown up for the exam each year since 2019, compared to the total registrations. Last year, for instance, out of 2.95 lakh registered candidates, only approximately 2.58 lakh actually took the exam. For CAT 2026, an estimated turnout of around 2.5 lakh is anticipated.
This discrepancy between registered and appearing candidates can be attributed to several factors. Many individuals register "just to see," without serious intent to pursue admission. Others may secure campus placements or experience a shift in career priorities due to appraisal cycles or other professional commitments. These candidates, having paid the registration fee, were never truly a competitive threat for those aiming for top percentiles. Therefore, while the headline number of registrations has decreased by 11,000, the actual number of serious contenders has likely seen a more marginal reduction, a fact often overlooked in the initial panic or relief surrounding the registration figures.
Percentile as a Share, Not a Static Score
The fundamental principle of percentile ranking is that it represents the percentage of candidates one has outperformed. A 99th percentile signifies that an aspirant has scored better than 99% of the candidates who took the exam. This metric is intrinsically linked to the size of the candidate pool present on exam day.
When the number of test-takers decreases, the absolute number of candidates within each percentile band also shrinks proportionally. For example, with approximately 2.58 lakh candidates appearing last year, the 99th percentile likely corresponded to the top 2,580 candidates. With an estimated 2.5 lakh candidates this year, this number reduces to roughly 2,500.
This means that while the proportion of candidates above or below a certain score remains consistent, the absolute number of individuals in each band changes. A smaller pool does not automatically grant a higher percentile; it simply makes each percentile band slightly less crowded. The crucial determinant of reaching a specific percentile is not the total number of registrations, but rather the candidate’s performance relative to others in the examination hall.

The Decisive Factor: Exam Difficulty, Not Applicant Count
The most significant variable influencing the marks required for a particular percentile is the difficulty level of the CAT paper itself. Historical data over the past five years reveals substantial fluctuations in the marks needed to achieve the 99th percentile, ranging from 76 to 98. Crucially, these shifts correlate far more closely with the perceived difficulty of the examination than with the number of registered candidates.
A stark illustration of this lies in the comparison between CAT 2023 and CAT 2024. While the number of test-takers remained relatively stable, the score required for the 99th percentile surged by 19 marks due to a comparatively easier CAT 2024 paper. Conversely, between CAT 2021 and CAT 2022, despite an increase of 30,000 more candidates appearing for the exam, the 99th percentile score actually decreased by 14 marks, indicating the dominant role of paper difficulty.
This evidence underscores a critical lesson: the percentile achieved is a function of how well an individual performs against the challenges presented by the exam, and how the entire cohort navigates those challenges. A reduction of 11,000 registrations is unlikely to have as profound an impact on percentile conversion as a single difficult section or a series of trickier questions within the examination. Aspirants would benefit from consulting resources that track section-wise performance and historical score-to-percentile conversions to gain a more accurate understanding of this dynamic.
A Modest Advantage: The Impact on Lower Percentile Bands
While the higher percentile bands may not see a dramatic shift due to reduced registrations, there is a marginal advantage to be gained at the lower end of the spectrum. IIMs maintain a fixed number of seats, and their shortlisting process involves calling a certain number of candidates for interviews. When the applicant pool shrinks, IIMs might need to delve deeper into the percentile list to fill these predetermined quotas.
To illustrate this, consider hypothetical scenarios for shortlist sizes:
| If an institute calls… | 2.93 lakh appear (2024) | 2.58 lakh appear (2025) | ~2.5 lakh appear (2026, expected) |
|---|---|---|---|
| 3,000 candidates (top IIM size) | 98.98 %ile | 98.84 %ile | 98.80 %ile |
| 15,000 candidates (mid-tier size) | 94.88 %ile | 94.19 %ile | 94.00 %ile |
At the higher end, the shift in the qualifying percentile is approximately 0.2, equating to a few marks, which can easily be influenced by a single error. However, in the 94-95 percentile band, the change is closer to 0.9 percentile. This represents a more tangible, albeit still modest, tailwind for candidates targeting calls from mid-tier IIMs.
It is imperative to acknowledge two significant caveats. Firstly, IIMs publicly declare minimum percentile cutoffs as policy, and these are not typically adjusted downwards solely due to a dip in registration numbers. Secondly, the final shortlist is a composite score that includes academic performance (Class 10, 12, graduation), work experience, and diversity points. Therefore, relying solely on percentile figures derived from applicant numbers without considering the comprehensive shortlisting criteria of target IIMs would be imprudent. Aspirants are strongly advised to consult detailed guides on IIM shortlisting criteria for a personalized assessment.
Who is Likely Opting Out?
While definitive data on non-registrants is unavailable, informed reasoning suggests that the candidates opting out are likely not those who form the core competition for the 95+ percentile. Several factors are believed to contribute to this trend:
- Robust Job Market for Graduates: A strong job market for fresh graduates can reduce the immediate pressure to pursue an MBA, especially for those who have secured promising offers.
- High IIM Fees: The increasing fee structure of flagship IIMs, now hovering around ₹21 lakh, can be a deterrent for some aspirants, particularly those who are not fully committed.
- Crowded Entrance Exam Calendar: The overlap with other major MBA entrance exams like NMAT, SNAP, and XAT can lead some candidates to prioritize other tests or spread their focus thinly, potentially leading them to skip CAT if they feel less prepared.
- Past Admissions Uncertainty: The admission cycles of the previous year, marked by issues such as revoked offers and re-issued result lists, may have created a sense of apprehension and uncertainty, prompting some casual aspirants to sit out.
These pressures tend to impact the "undecided" aspirant the most. The serious candidate, who has invested heavily in mock tests, meticulously tracked their accuracy in different sections, and developed a strategic exam-day plan, is less likely to be deterred by fee hikes or a crowded calendar. Consequently, the CAT 2026 applicant pool is likely to be comprised of a more determined and focused set of individuals, rather than a weaker one. This is not a cause for panic, but rather a call to sustained effort and rigorous preparation.
Maximizing the Remaining 38 Days: Focus on Controllables
With the CAT 2026 examination just 38 days away, the focus must unequivocally shift from external factors like registration numbers to controllable elements that directly impact performance. The data consistently points towards the following areas for concentrated effort:
- Mock Test Analysis: Beyond simply taking mocks, the critical step is to thoroughly analyze performance. Identify weak areas, understand the rationale behind incorrect answers, and refine strategies for time management and question selection.
- Sectional Accuracy: Target specific sections where accuracy needs improvement. Dedicate focused practice sessions to tackle challenging question types and build confidence.
- VARC Strategy: The Verbal Ability and Reading Comprehension (VARC) section often requires consistent practice to build reading speed, comprehension skills, and accuracy in vocabulary and grammar-based questions.
- DILR Practice: The Data Interpretation and Logical Reasoning (DILR) section demands logical thinking and analytical skills. Solving a variety of sets and understanding different data formats is crucial.
- Quantitative Aptitude Refinement: For Quantitative Aptitude (QA), focus on strengthening fundamental concepts and practicing speed-based calculations. Identifying recurring question patterns and developing efficient problem-solving techniques is key.
- Exam Day Simulation: Simulate exam conditions during mocks, including the time constraints and the pressure of the examination hall. This will help in building mental fortitude and adapting to the actual test environment.
A More Constructive Message to Share
Instead of perpetuating the myth of falling cutoffs, it is more beneficial to share a nuanced and realistic perspective. The next time the "cutoffs will fall" message circulates, consider forwarding this refined message:
- Registration numbers are down, but the serious competition remains. The decline is primarily among casual applicants.
- Your percentile is determined by your performance against the exam’s difficulty, not the total number of candidates.
- The real impact on your score comes from the paper’s design, not the applicant pool size.
- Focus your energy on what you can control: your preparation, your strategy, and your execution on exam day.
- The CAT 2026 exam will test your skills and preparedness, regardless of the registration figures.
The CAT 2026 journey is characterized by fewer aspirants, persistent anxiety, and the same demanding examination. The key to success lies in rigorous preparation and a clear understanding of what truly influences your chances of admission.
Connect with alumni and students for insights. Join: CAT 2026 Exam Preparation, Discussion | PaGaLGuY.
The examination is scheduled for November 29, 2026.